
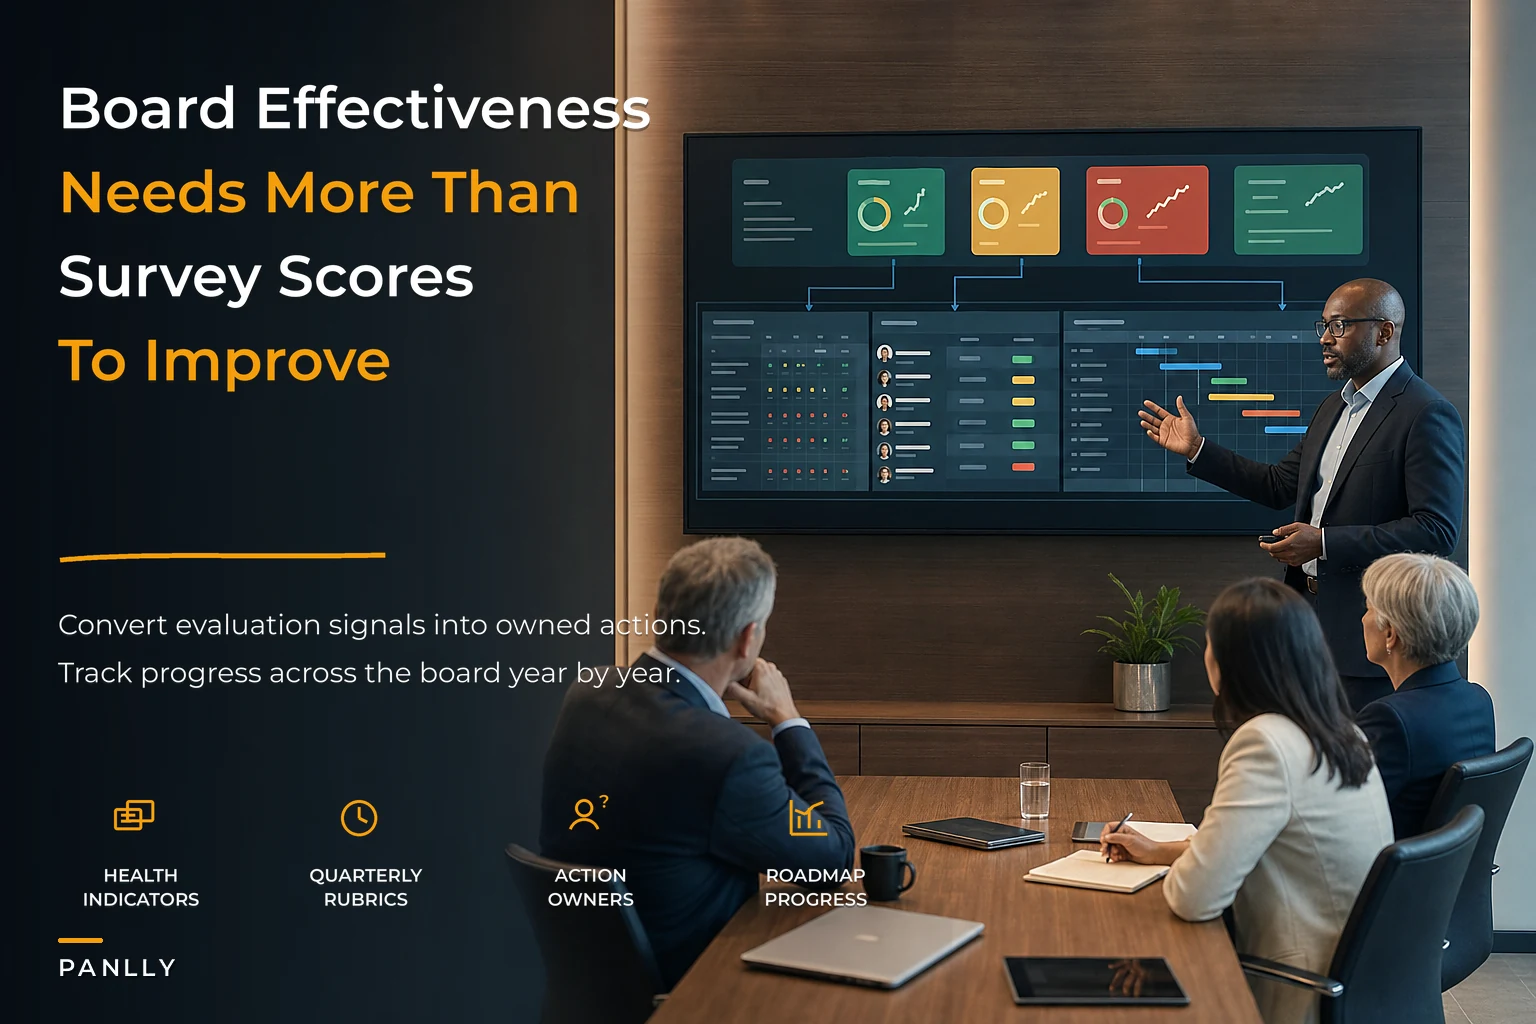

Most board evaluations die in a drawer. A director fills out a questionnaire once a year, someone tallies the scores, the corporate secretary writes a two-page summary that says "communication could improve" and "meeting materials arrive late," the board nods, and then nothing changes. Twelve months later the same survey produces the same complaints. The evaluation happened. The improvement didn't.
That gap — between measuring effectiveness and actually improving it — is the real problem. And it's not because directors don't care. It's because the survey is a snapshot, not a system. A snapshot tells you the temperature. It doesn't fix the furnace.
A proper board effectiveness measurement system treats effectiveness the way a good operator treats any performance area: rolling indicators, defined owners, scoring rubrics that mean the same thing every quarter, and a multi-year roadmap that outlives any single chair or lead director. This piece walks through how those pieces fit together, where they break, and what the whole thing looks like when it's working.
Why the annual survey model quietly fails
The annual survey isn't useless. It's just structurally incapable of driving change, and it's worth understanding why before building something better.
First, it measures perception at a single moment. A director who sat through a chaotic meeting the week before the survey scores "meeting effectiveness" harshly. A director who missed that meeting scores it fine. You're averaging moods, not measuring a process.
Second, survey findings almost never carry an owner. "Board materials should be more concise" is a finding without a person attached. Nobody wakes up owning "conciseness." Compare that to how you'd handle a missed compliance deadline — someone's name is on it, there's a due date, and there's an escalation path if it slips. Board effectiveness findings rarely get that treatment.
Third, and this one quietly does the most damage: there's no memory. The board that debated whether committee reporting was too shallow last year has no record of what it decided to do about it. Institutional memory around governance improvement is thin, which is exactly why the same issues keep resurfacing. It's the same failure mode we've written about in the context of preventing repeated debates with a board decision log — findings without a durable record get relitigated instead of resolved.
What boards tend to get from the survey is sentiment when what they actually need is a scoreboard plus a plan. Sentiment feels productive. It isn't.
The four moving parts of a real measurement system
A working system has four components that connect to each other. Miss one and the whole thing degrades back into a survey.
Eliminate boardroom chaos with seamless coordination.
Panlly simplifies scheduling, collaboration, and follow-ups for every board meeting.
- Centralized meeting scheduling
- Secure document sharing
- Task assignment & tracking
No credit card required
-
A rolling KPI/indicator suite — a set of indicators tracked continuously, not once a year, so trends are visible before they become complaints.
-
Scoring rubrics — explicit definitions of what a 1, 3, or 5 means for each indicator, so scores are comparable across quarters and across directors.
-
Remediation plans with owners — every gap gets a named owner, a target, a due date, and an escalation trigger.
-
A multi-year improvement roadmap — a sequenced plan that says which capabilities the board builds in year one versus year three.
The value isn't in any single piece. It's in the loop: indicators surface a gap, the rubric quantifies it, a remediation plan assigns it, and the roadmap tracks whether the board is actually maturing over time. Break the loop anywhere and you're back to sentiment.
Building a rolling indicator suite
The shift from annual to rolling is the single most important change, so start here.
Most board effectiveness signals already exist in the plumbing of governance operations. You don't need a new survey to know whether materials arrive late — the meeting portal timestamps every upload. You don't need to ask whether decisions get followed through — the action-item tracker shows completion rates. A lot of effectiveness is measurable from operational data the board is already producing.
-
Process indicators — material distribution lead time, meeting start/end punctuality, agenda-to-minute turnaround, action-item closure rate, quorum reliability.
-
Coverage indicators — whether the board actually spent time on the strategic priorities it committed to. This ties directly to how you run a multi-year board agenda portfolio; the agenda plan becomes the benchmark you measure coverage against.
-
Perception indicators — the qualitative stuff surveys are good at: quality of debate, psychological safety, chair effectiveness. Keep these, but sample them more often and in shorter form.
Here's a compact starting suite:
| Indicator | Type | Data source | Target | Cadence |
|---|---|---|---|---|
| Board pack distributed ahead of meeting | Process | Portal upload timestamp | ≥ 5 business days | Every meeting |
| Action items closed by due date | Process | Action tracker | ≥ 85% | Monthly |
| Agenda time on strategic priorities | Coverage | Minutes / agenda | ≥ 40% of session | Quarterly |
| Directors rating debate quality "strong" | Perception | Short pulse (3 questions) | ≥ 75% | Quarterly |
| Committee findings escalated to full board | Coverage | Committee reports | 100% of flagged items | Quarterly |
| Meeting overrun vs scheduled end | Process | Meeting log | < 15 min average | Every meeting |
Notice the cadences vary. Process indicators every meeting, perception quarterly. A common mistake is forcing everything onto the same annual clock — that's what created the snapshot problem in the first place.
One thing worth flagging: don't over-index on process indicators just because they're easy to collect. A board can hit every process target and still be ineffective if the debate is shallow and the hard questions never get asked. Process indicators are necessary and relatively cheap to track. They're not sufficient on their own.
When starting, prioritize a small set of process indicators that unblock noise first, then add qualitative rubrics once data discipline is trusted.
Process indicators are necessary and relatively cheap to track. They're not sufficient on their own.
Scoring rubrics that survive a change of chair
The reason most scoring is unreliable is that "4 out of 5 on board dynamics" means something different to every person who scores it, and something different again when a new lead director takes over the evaluation.
A rubric fixes this by pinning down what each level actually describes. Take "quality of strategic debate":
-
1 — Absent Strategy items are presented and approved with little discussion; dissent is rare or absent.
-
3 — Functional Directors engage, ask clarifying questions, but debate rarely changes the proposed direction.
-
5 — Robust Directors surface alternatives, management defends assumptions, and it's normal for a proposal to be reshaped or sent back.
Now two directors scoring the same meeting land in roughly the same place, and a score of 3 this year versus 3 next year actually means the same thing. That comparability is what makes trend lines trustworthy — and trend lines are the whole point of going rolling.
Write rubrics specifically for the qualitative indicators, because those are the ones that drift. Process indicators mostly self-define (a pack is either five days early or it isn't). Spend your rubric-writing energy on debate quality, chair effectiveness, committee-to-board information flow, and director preparedness — the areas where "how would you rate…" invites everyone to invent their own scale.
Remediation plans: turning a low score into a tracked commitment
This is the step that separates a measurement system from a report. A score of 2 on "action-item closure" is not a finding. It's a trigger. Something specific has to happen because of it.
A remediation entry needs, at minimum, five fields:
-
The gap — stated as an observable condition, not a vague complaint. Not "follow-through is weak" but "38% of action items missed their due date last quarter."
-
The owner — one named person accountable. Not "the board." Not "management." A person.
-
The intervention — the specific change being made.
-
The target and date — what "fixed" looks like and when.
-
The escalation trigger — what happens if it's still red at the next check.
A worked example: suppose the closure indicator sits at 62% against an 85% target. The remediation entry might read: gap is chronic late closure on cross-committee items; owner is the corporate secretary; intervention is a standing action-item review as the first agenda item each meeting plus deadline-based reminders to item owners; target is 85% within two quarters; escalation is a direct review by the governance committee chair if still below 75% after one quarter.
That's a commitment with a name on it. It runs on the same discipline the board expects from management — which is exactly the point.
The multi-year roadmap: sequencing the maturity
A lot of boards get impatient here and blow it. They look at their first scored evaluation, see eight red indicators, and try to fix all eight at once. Everything gets a task, nothing gets real attention, and by the next cycle most of the "improvements" have quietly evaporated.
-
Year 1 — Instrument and stabilize. Get the indicator suite running, get clean data, fix the obvious process failures — late packs, meeting overruns, unclosed actions. These are high-confidence wins that build trust in the system itself.
-
Year 2 — Deepen the substance. With process noise reduced, focus on the harder indicators: debate quality, committee-to-board information flow, coverage of strategic priorities. This is also where composition and skills gaps tend to surface, which connects naturally to the evaluation-to-succession lifecycle — some effectiveness gaps are really a composition problem in disguise.
-
Year 3 — Optimize and externalize. Benchmark against peers, bring in periodic external review, and tie board effectiveness data into broader governance reporting. By now the system runs itself and the board is refining rather than repairing.
The roadmap also protects continuity through leadership turnover. When the chair changes in year two, the incoming chair inherits a scoreboard and a documented plan, not a blank slate and a folder of old survey PDFs.
What a dashboard and drilldown actually look like
The board doesn't want the raw indicator table every quarter. It wants a top-level read with the ability to drill into whatever's red.
The top layer is a simple health view: each indicator category shown as green/amber/red with a trend arrow. Governance operations: green, steady. Strategic coverage: amber, improving. Board dynamics: amber, flat. That's a 30-second read for a busy director.
Here's a simple workflow for the dashboard and drilldown:
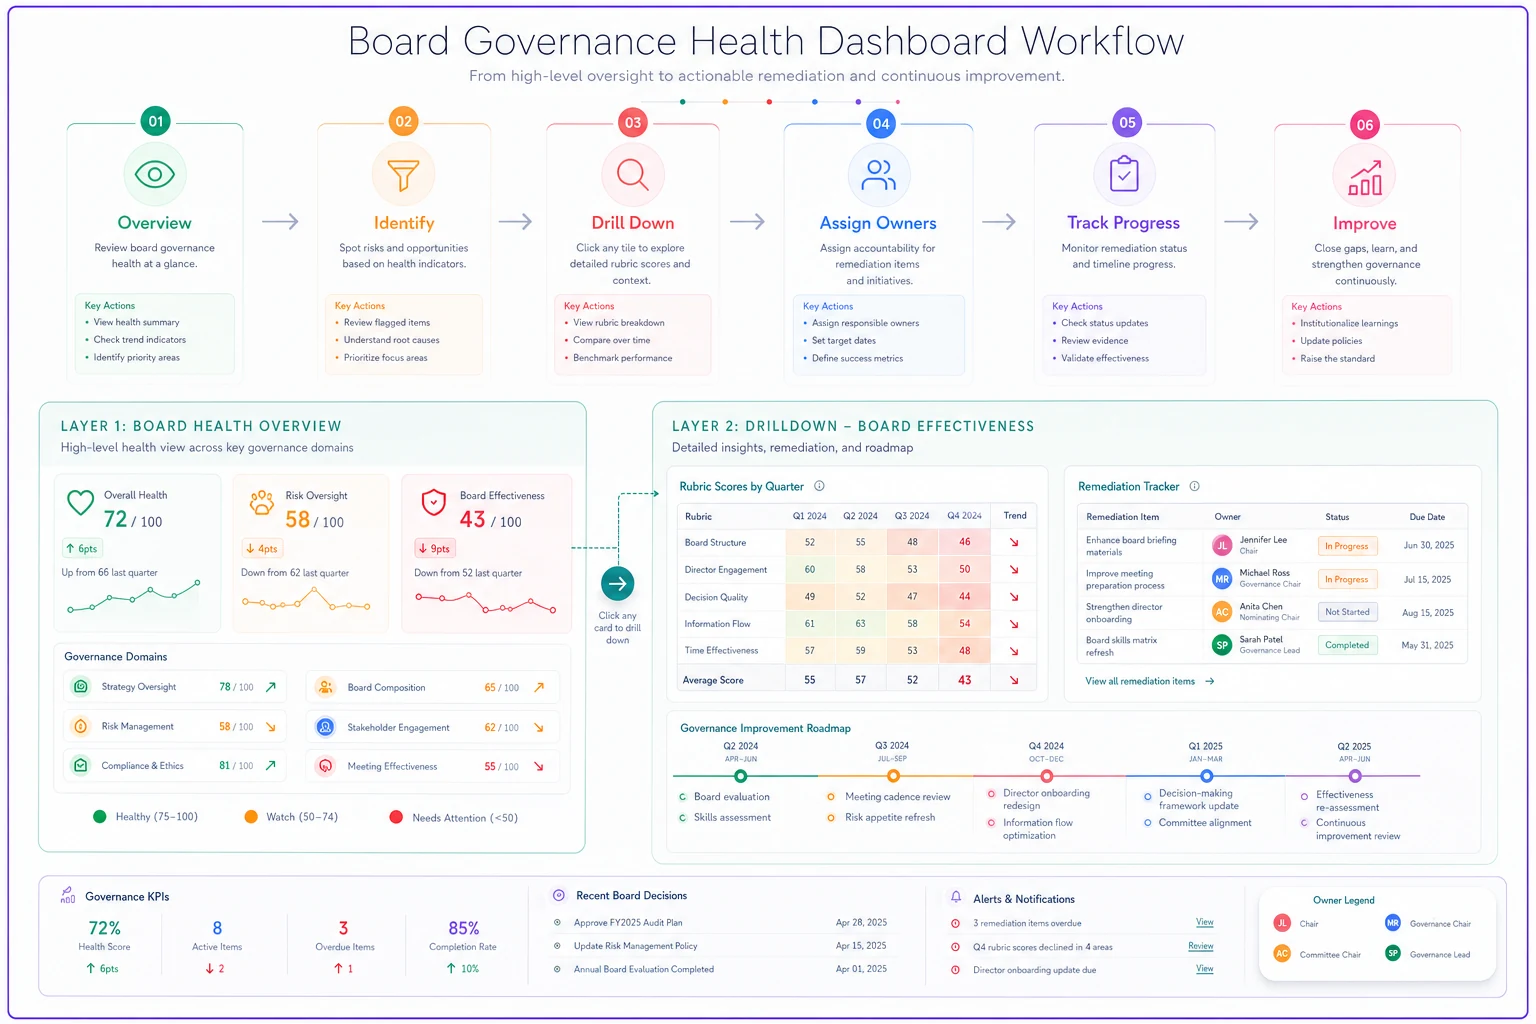
The drilldown sits underneath. Click "board dynamics" and you get the underlying rubric scores by quarter, the specific remediation entries tied to that category, their owners, and current status. A director asking "why is dynamics still amber?" gets a real answer — "debate quality improved from 2.8 to 3.4, but committee-to-board escalation is still lagging, owner is the audit chair, target next quarter" — instead of a shrug.
That two-layer structure matters operationally. The summary keeps the board out of the weeds; the drilldown means nobody can wave away a red indicator with vague reassurance.
A short real scenario
A mid-sized company — regional, roughly $200M in revenue, nine-person board with three committees — had run the same annual effectiveness survey for years. Every year the summary flagged "late materials" and "insufficient strategic discussion." Every year, no change.
They switched to a rolling system. In the first two quarters they instrumented three process indicators and ran a short quarterly pulse instead of the annual survey. The data made the "late materials" complaint concrete: packs were arriving on average two days before meetings against their own five-day standard, and in one quarter roughly 40% of action items missed their due dates.
Both got remediation entries with owners. Pack distribution moved to the corporate secretary with a hard cutoff; action items got a standing first-agenda-item review. By the end of year one, pack timeliness was consistently hitting the five-day target and action closure had climbed into the low-to-mid 80s from the low 60s. Strategic coverage — the harder problem — they deliberately deferred to year two rather than pretend they could fix everything at once.
The outcome that mattered wasn't the specific numbers. It was that, for the first time, the board could see whether it was actually getting better. And the improvements survived a chair transition halfway through year two because the plan lived in the system, not in one person's head.
When this makes sense — and when it doesn't
When it's worth building: boards past the small-startup stage, especially those with multiple committees, regulated industries, or any environment where governance quality gets scrutinized by regulators, investors, or litigation. If your evaluation findings keep repeating year after year, that alone is the signal.
When it's overkill: a very early-stage board of three or four people meeting informally doesn't need a rolling KPI suite. A lightweight quarterly conversation with a short written record is plenty. Building heavy machinery here just creates process for its own sake.
Who should NOT do this: any board that isn't prepared to attach owners to findings. If the culture won't tolerate a named director being accountable for a remediation item, the system will collapse into the same toothless survey you already have — just with more spreadsheets. The rubrics and dashboards are the easy part. The willingness to own gaps is the hard part, and without it, don't bother.
Where tooling fits, quietly
Most of what makes this system work is discipline, not software. That said, the rolling piece gets painful fast if you're stitching it together by hand — pulling upload timestamps from a portal, tracking action closure in a separate spreadsheet, running pulses in a survey tool, and manually keeping remediation status current.
That kind of manual reconciliation is exactly where these systems decay, because the person maintaining it burns out and the data goes stale. Governance platforms that already hold your meeting materials, action tracker, and decision records can surface a lot of these indicators automatically. Lightweight automation can handle the tedious parts — reminding action-item owners before due dates, flagging when a pack is going to miss the distribution window, rolling last quarter's rubric scores forward for comparison.
The point isn't to automate judgment. It's to remove the busywork that otherwise kills the rolling cadence. Keep the human judgment on the rubrics and the remediation plans; let the tooling keep the scoreboard current.
The takeaway
The difference between a board that measures effectiveness and a board that actually improves comes down to whether the evaluation is a snapshot or a loop. Rolling indicators surface gaps early. Rubrics make scores mean something over time. Remediation plans put names and dates on the gaps. A multi-year roadmap keeps the board building maturity instead of re-diagnosing the same problems every January.
Put those four pieces together, keep the data current, and effectiveness stops being an annual opinion poll and starts being something you can actually watch get better.
The difference between a board that measures effectiveness and a board that actually improves comes down to whether the evaluation is a snapshot or a loop. Rolling indicators surface gaps early. Rubrics make scores mean something over time. Remediation plans put names and dates on the gaps. A multi-year roadmap keeps the board building maturity instead of re-diagnosing the same problems every January.
Put those four pieces together, keep the data current, and effectiveness stops being an annual opinion poll and starts being something you can actually watch get better.
Ready to enhance your board's productivity?
Join 500+ organizations using Panlly to save time, improve governance, and streamline board operations.