

Most boards find out they have a concentration problem the same way — a vendor goes dark, and suddenly three business units are frozen because they all quietly depended on the same payments processor, the same logistics partner, or the same cloud region. The dependency was never hidden. It just lived in fourteen different contracts, two procurement spreadsheets, and nobody's head at the same time.
The gap isn't awareness that concentration risk exists. Every director knows it exists. The gap is that the board has no single number in front of it that says "if this vendor fails, here's the revenue at risk, here's the recovery time, and here's the trigger we already agreed to pull." Without that, concentration sits in the risk register as a vague red dot and gets discussed once a year with no action attached.
This is a walkthrough of building a vendor concentration dashboard for boards that actually does something — with sample math, escalation thresholds you can adopt, and remediation resolutions drafted tightly enough to drop into minutes the same day.
Start with the exposure number, not the vendor list
The mistake most concentration reporting makes is starting as a list. Here are our top 20 vendors by spend. That tells the board almost nothing about risk, because spend and exposure are different things. A $400k-a-year vendor you could replace in a week is far less dangerous than a $90k vendor whose API is wired into every checkout you run.
-
Revenue dependency — how much revenue touches this vendor, directly or indirectly
-
Substitutability — how fast could you realistically switch, including re-integration time
-
Recovery time — how long until you're operational if they go dark tomorrow
-
Data/regulatory entanglement — do they hold regulated data or sit in a compliance path
-
Single-point flag — is there a second source, or is this genuinely the only one
You don't need a data science project for this. A simple 1–5 scale on each factor, weighted, gets you a comparable score across vendors that are otherwise nothing alike.
Here's the kind of table that belongs in the board pack — not the raw contract dump, this:
| Vendor | Function | Annual spend | Revenue exposed | Substitutability (1–5) | Recovery time | Concentration score |
|---|---|---|---|---|---|---|
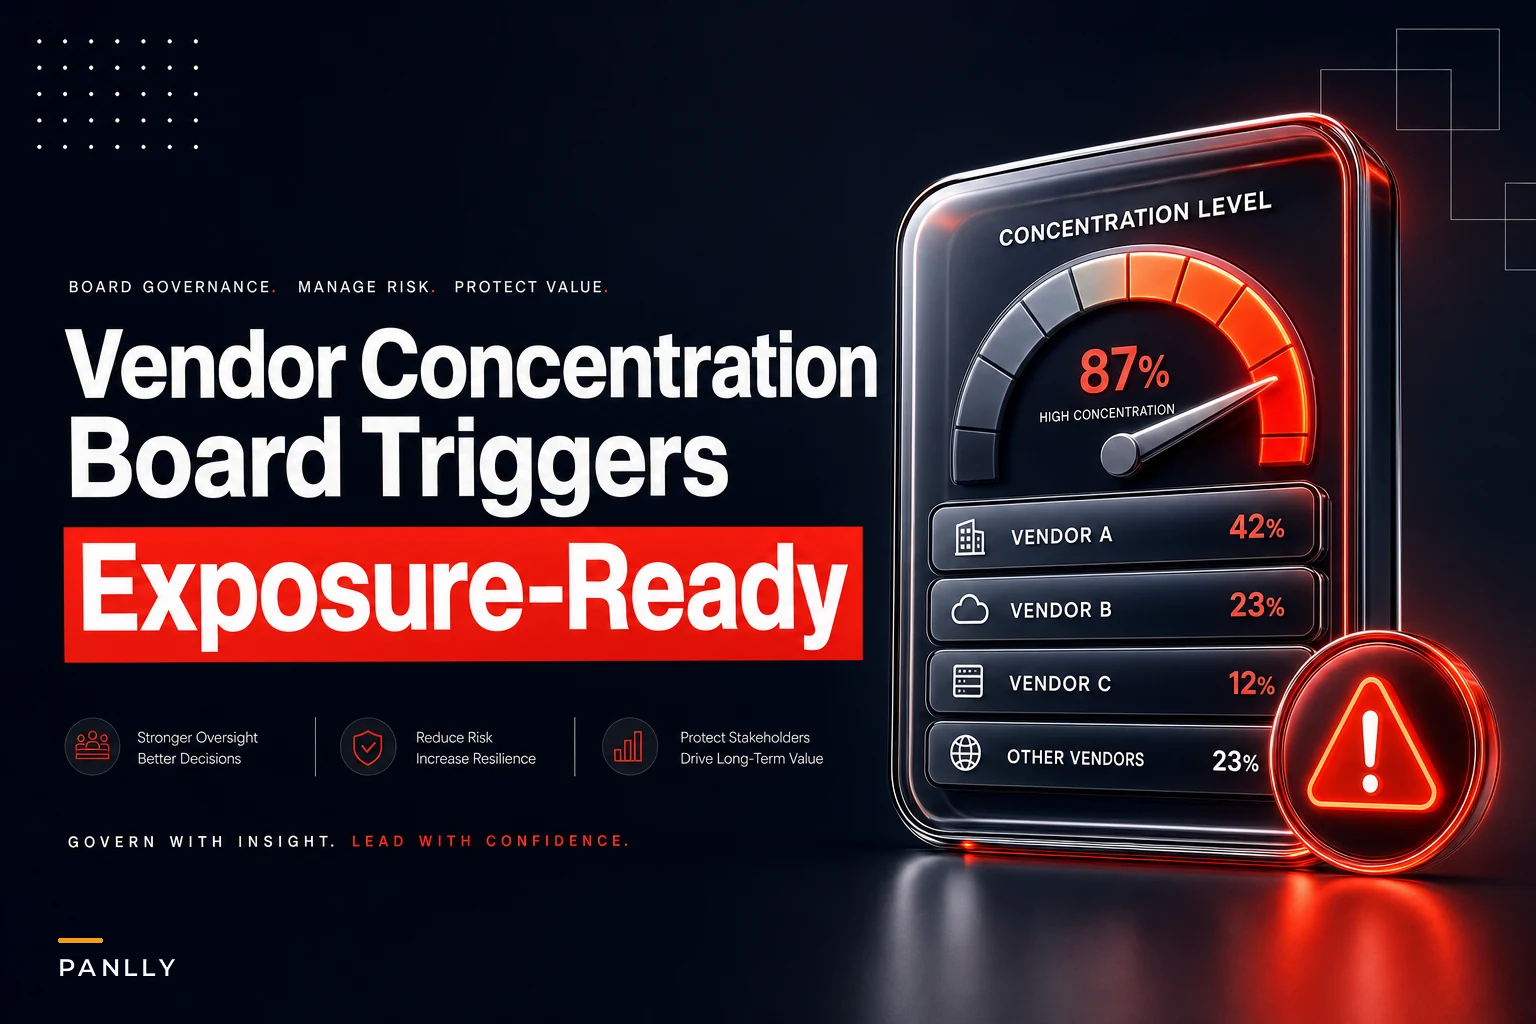
| Vendor A | Payments processing | ~$310k | ~$41M (est. flow) | 5 (very hard) | 6–9 weeks | 92 |
| Vendor B | Cloud region (primary) | ~$1.2M | ~$60M | 4 | 3–5 weeks | 88 |
| Vendor C | 3PL / fulfillment | ~$2.4M | ~$28M | 3 | 2–3 weeks | 61 |
| Vendor D | Payroll/HRIS | ~$180k | payroll continuity | 4 | 4 weeks | 57 |
| Vendor E | Marketing SaaS | ~$95k | indirect | 2 | days | 22 |
Notice Vendor E — the second-lowest spend — sits near the bottom of the risk stack even though it shows up in every "top vendors by cost" report. And Vendor A, roughly a seventh of Vendor C's spend, is the single most dangerous line on the page. That inversion is the entire point. Spend rankings hide the vendors that can actually stop your business.
Sample calculation: how a concentration score comes together
Let's build Vendor A's score so the method is transparent rather than a magic number the board is asked to trust.
Eliminate boardroom chaos with seamless coordination.
Panlly simplifies scheduling, collaboration, and follow-ups for every board meeting.
- Centralized meeting scheduling
- Secure document sharing
- Task assignment & tracking
No credit card required
Say the board agrees on these weights: revenue dependency 35%, substitutability 25%, recovery time 20%, data/regulatory 10%, single-point flag 10%.
-
revenue dependency 35%
-
substitutability 25%
-
recovery time 20%
-
data/regulatory 10%
-
single-point flag 10%
Vendor A scores:
-
Revenue dependency
5 (nearly all card revenue flows through it)
-
Substitutability
5 (deep integration, PCI re-scoping needed to switch)
-
Recovery time
4 (6–9 weeks is long but not catastrophic)
-
Data/regulatory
4 (cardholder data, PCI path)
-
Single-point flag
5 (no active secondary processor)
Convert each to a 0–100 sub-score (score ÷ 5 × 100), then apply weights:
(100×0.35) + (100×0.25) + (80×0.20) + (80×0.10) + (100×0.10)
= 35 + 25 + 16 + 8 + 10 = 94
We rounded to 92 in the table after a small offset for a partial manual fallback that exists. The exact figure matters less than the fact that everyone can see how it was built and can argue with an input rather than the conclusion. When a director says "I think the recovery time estimate is optimistic," you change one cell and the score moves. That's a board conversation worth having. A red dot with no math behind it isn't.
Set escalation thresholds the board actually pre-approves
A dashboard that just displays scores becomes wallpaper by the third quarter. What makes it operational is agreeing — in advance, in a resolution — on what score triggers what action. Then the trigger fires on its own instead of waiting for someone to feel worried enough to raise it.
A workable threshold model:
-
Score 0–40 — Monitor. Standard annual review. No board action.
-
Score 41–65 — Watch. Management reports mitigation status quarterly. Named owner required.
-
Score 66–80 — Act. Management must present a remediation plan with dates at the next meeting. Cannot roll over untouched.
-
Score 81–100 — Board trigger. Automatic agenda item. Remediation resolution required this cycle, plus a contingency playbook on file before the next meeting.
Pre-approving these bands removes the awkward political moment where someone has to decide this vendor is scary enough to escalate. The number decides. A vendor crossing 80 is no longer a judgment call about whether to bring it up — it's already on the agenda by rule.
The flow below shows who is notified and what action fires at each band.
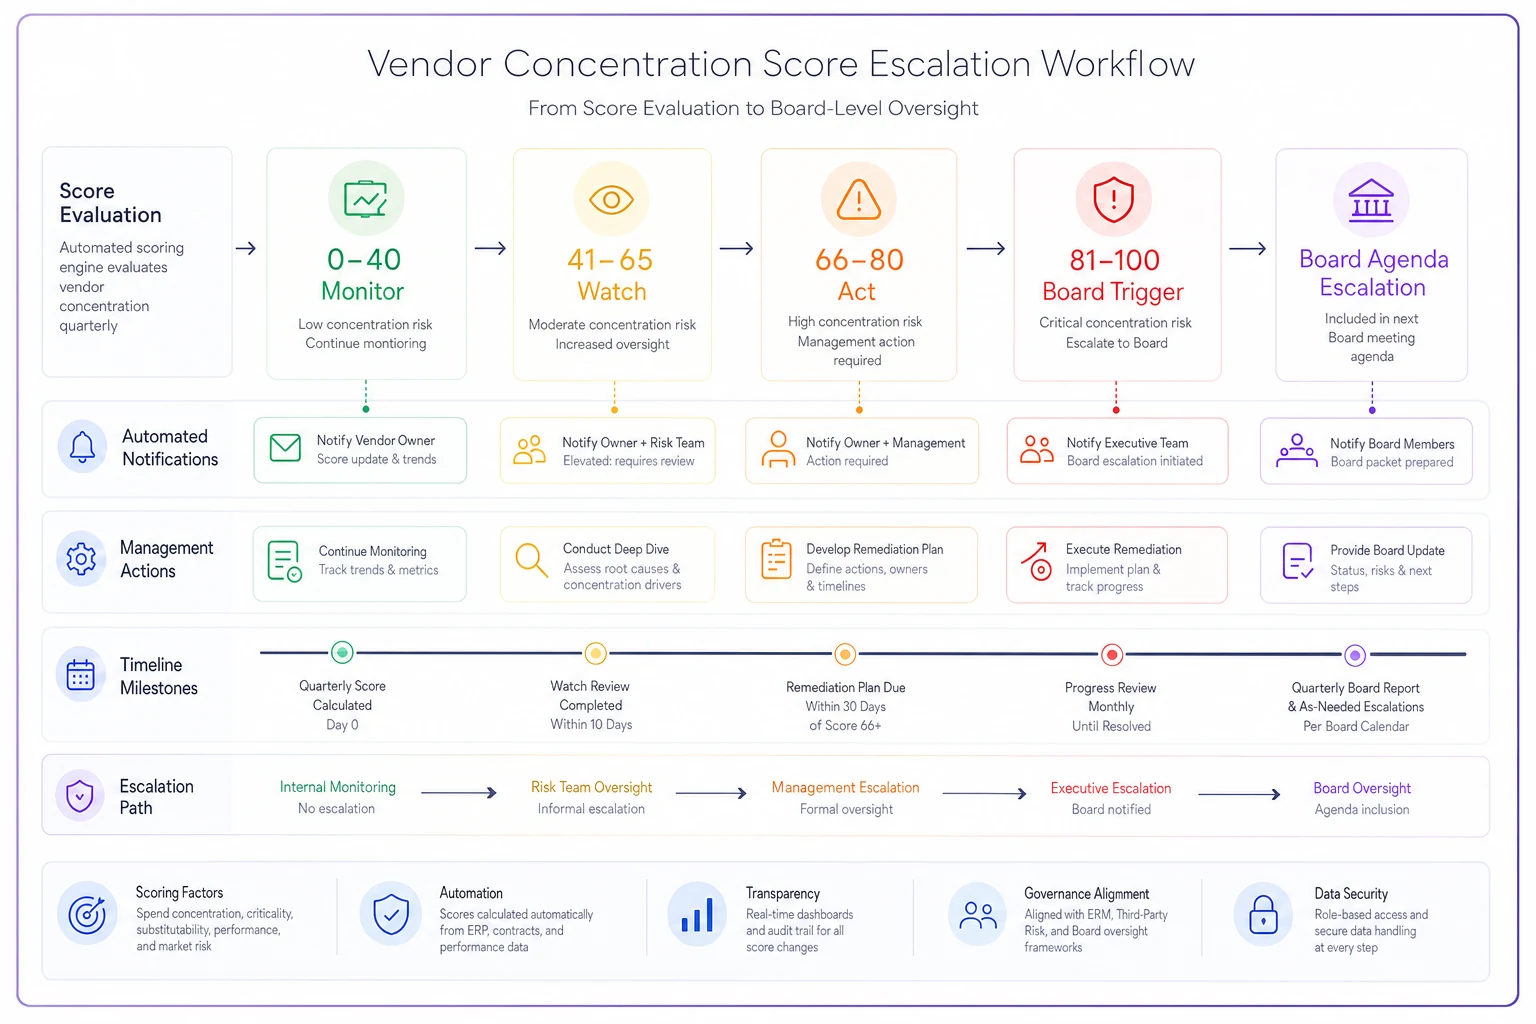
The other thing thresholds fix is drift. Concentration rarely spikes overnight. Vendor B creeps from 71 to 79 to 84 over three quarters as you migrate more workloads onto it. Without banded triggers, each quarterly increment looks small enough to ignore, and you only notice the accumulated exposure after the crossing. Fixed thresholds catch it automatically.
The contingency playbook: written before you need it
Most contingency plans get written during the outage, by the same people who are also trying to fix the outage. That's the worst possible time to be drafting a decision tree.
Each vendor scoring above the Act threshold should have a one-page playbook on file, and the board should have confirmed it exists. Not read every line — confirmed it exists and has an owner. The playbook contains:
-
Trigger definition — what specifically counts as failure (full outage, degraded service beyond X hours, insolvency notice, breach disclosure)
-
First-hour actions — who is called, what gets switched off, what manual fallback engages
-
Named decision owner — the single person authorized to activate the plan without waiting for a meeting
-
Financial exposure clock — approximate cost per day of downtime, so urgency is quantified
-
Switch path — the pre-identified alternate, even if it's slower or partial
-
Communications — who tells customers, regulators, and the board, and when
Keep the alternate warm with a signed standby agreement or a tested integration so the switch path is actually executable under pressure.
The financial exposure clock is the part boards consistently underweight. When Vendor A's playbook says "estimated $180k–$220k in stalled transactions per day of full outage," the board isn't debating whether to spend on a secondary processor anymore. The daily number does the arguing.
For the switch path to actually work, someone has to have kept the alternate warm — a signed standby agreement, a tested integration, or at minimum a documented manual process. A playbook that says "find a new payments provider" isn't a playbook. It's a wish.
Minute-ready remediation resolutions
Concentration decisions stall for a predictable reason: when the board finally decides to act, someone still has to draft the resolution, circulate it, and get it approved next cycle — adding another quarter of exposure. Pre-drafting the resolutions removes that lag entirely.
> RESOLVED, that the Board, having reviewed the concentration exposure for [Vendor], scored at [score] and exceeding the pre-approved escalation threshold of [threshold], directs management to [establish a secondary source / negotiate contractual continuity terms / complete a documented failover test] no later than [date], with a status report to the [Committee] at its next meeting; and further that the estimated daily exposure of [amount] be recorded in the risk register and the contingency playbook for [Vendor] be confirmed current as of this date.
That's minute-ready. It names the vendor, the score, the threshold breached, the required action, the deadline, the owner, and the exposure figure — everything a regulator or plaintiff's counsel would want to see later, and everything the board needs to hold management accountable next quarter.
Tying these resolutions back to a durable record is what keeps the same concentration debate from resurfacing every year with no memory of what was decided. A proper board decision log that preserves institutional memory means next year's board can see the resolution passed, the deadline set, and whether management actually delivered — instead of rediscovering Vendor A from scratch.
A real scenario: the payments concentration nobody scored
A mid-market e-commerce group — three brands, combined revenue in the $50M–$60M range — ran everything through one payments processor. Nobody had ever flagged it as a concentration risk because in the top-vendor-by-spend report, the processor sat around eighth. Its fees were modest. Its risk was enormous.
The processor had a regional outage lasting most of a business day. Checkout failed across all three brands simultaneously. The rough damage: somewhere in the range of $190k–$230k in abandoned or failed transactions, plus a support surge and a chunk of customers who simply didn't come back to retry.
What made the aftermath worse was no pre-agreed trigger and no warm alternate. Management spent six weeks scrambling to onboard a secondary processor — a project that, had it been pre-approved when the concentration first crossed a threshold, would have already been done.
When they rebuilt their reporting around a scored dashboard, the processor came out at 92 — top of the stack, dwarfing vendors ten times its spend. That single visibility change moved the secondary-processor project from "someday" to a funded board resolution within one cycle. The exposure clock — a number, not a worry — is what did it.
Where this fits with the rest of your oversight
A concentration dashboard doesn't live in isolation. In multi-entity groups especially, the same vendor often appears across subsidiaries with different contract terms and no consolidated view — which is exactly the kind of thing a multi-entity delegated-authority matrix helps untangle, because you need to know who can actually sign the secondary contract before the outage, not during it.
And the playbooks, resolutions, and exposure math only help if the board can find them quickly when a vendor goes down. Contingency documents sitting in someone's inbox are worthless at hour one of an outage. Keeping them under a proper document taxonomy with searchable metadata is the difference between pulling the right playbook in two minutes and discovering it was never finalized.
When a full concentration dashboard makes sense — and when it's overkill
This level of structure is worth building when you have genuine single-source dependencies with meaningful revenue behind them — payments, primary cloud, core fulfillment, critical inputs. If a vendor failing would freeze operations or trigger a disclosure, it belongs on a scored dashboard with a pre-approved trigger.
For a business whose vendors are all easily substitutable and low-stakes, it's overkill. If your worst-case vendor failure means switching email tools over a weekend, you don't need escalation thresholds — you need a note in the risk register and a good afternoon.
Who should not attempt this yet: boards that don't have a reliable vendor inventory in the first place. The dashboard is only as honest as its inputs. If you can't confidently list which vendors touch which revenue, fix the inventory before you start scoring — a precise-looking score built on incomplete data is more dangerous than an obvious blank, because it invites false confidence.
Where automation quietly earns its place
The math and the resolutions are the hard part; keeping the scores current is the part that silently rots. Recovery-time estimates go stale, spend shifts, a subsidiary quietly onboards a fourth 3PL. This is where operational software with AI-assisted monitoring pulls its weight — flagging when a vendor's spend or dependency crosses a threshold between meetings, so the board sees the crossing when it happens instead of two quarters later. It doesn't make the decision. It makes sure the decision-worthy moment doesn't slip past unnoticed, and that the matching resolution and playbook are one click from the agenda when it does.
The point isn't the dashboard as an artifact. It's turning concentration from an annual worry into a monitored number with a pre-agreed trigger and a resolution already drafted — so the gap between "we should really deal with this vendor" and "we've directed management to fix it" collapses from three quarters to a single meeting.
Vendors will fail. The only question is whether your board pulls the remediation lever before the outage or after it.
Ready to enhance your board's productivity?
Join 500+ organizations using Panlly to save time, improve governance, and streamline board operations.