
Every quarter, board meetings derail the same way. Finance presents one set of numbers, operations shows something different, and suddenly directors are debating data accuracy instead of making actual decisions. The CEO sits there watching the meeting burn through an hour of expensive time arguing about dashboard formatting while real strategic work gets pushed to the end of the agenda.
The problem usually isn't the data quality or even the metrics themselves. It's that most organizations never actually connect board-level decisions to specific KPIs with clear ownership and reporting structures. What you get instead is governance theater — impressive-looking dashboards that don't drive decisions, and decisions that happen without any real measurement framework behind them.
The governance disconnect that costs companies millions
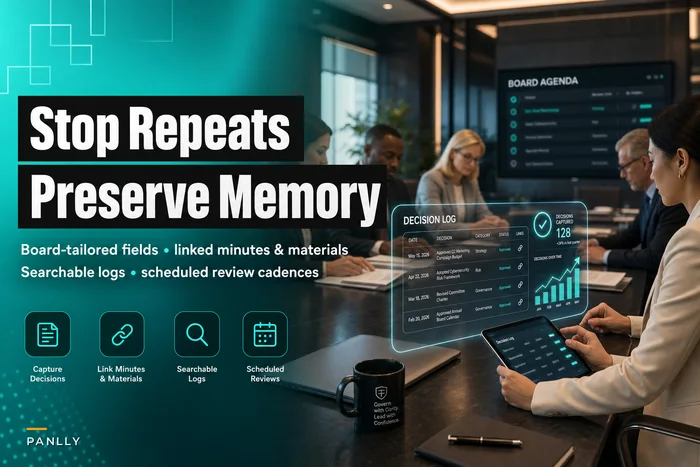
Here's what typically happens. A board approves a major strategic initiative — say, a $2M expansion into three new regions. The decision gets documented in minutes, maybe tracked in a decision log to preserve institutional memory, and then what? Six months later, someone asks how the expansion is performing and you get five different answers from five different executives, each using different metrics and different timeframes.
This gap between board decisions and operational metrics creates real blind spots. Across dozens of governance structures I've looked at, the pattern is consistent: organizations that don't map decision types to specific KPI frameworks end up repeating the same mistakes because they never properly measured what happened the first time.
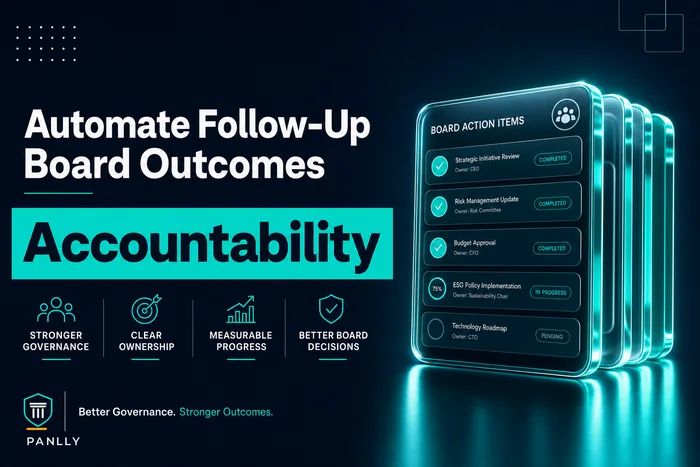
The damage shows up in three ways. Accountability becomes impossible when no one owns the metrics tied to specific decisions. Directors waste meeting time requesting custom reports because standard reporting doesn't match how they actually make decisions. And critical decisions get delayed because the board doesn't trust the numbers they're looking at.
Building a decision-to-KPI mapping framework
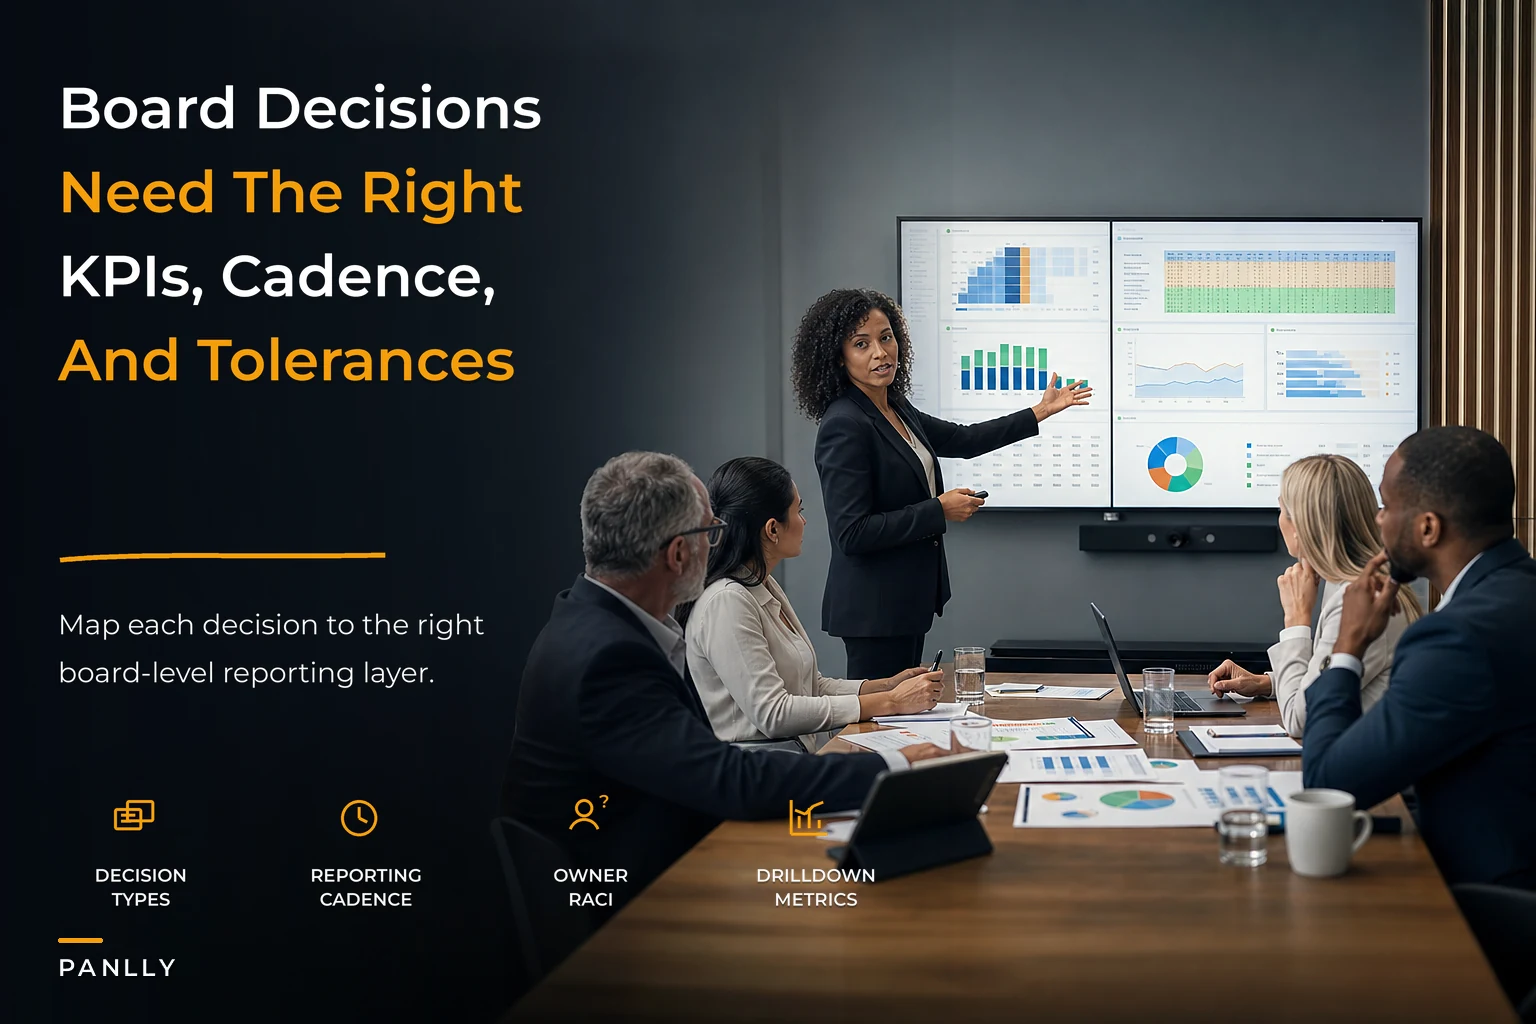
A proper board reporting framework starts by categorizing decision types and mapping each one to specific metrics, owners, and reporting cadences. This isn't about building more dashboards — it's about making sure every board decision has a measurement structure before it gets approved.
Eliminate boardroom chaos with seamless coordination.
Panlly simplifies scheduling, collaboration, and follow-ups for every board meeting.
- Centralized meeting scheduling
- Secure document sharing
- Task assignment & tracking
No credit card required
Most boards deal with five core decision types: strategic initiatives, capital allocation, risk management, compliance oversight, and executive performance. Each one requires different KPIs, different reporting frequencies, and different tolerance thresholds.
Strategic initiative decisions need both leading and lagging indicators. If the board approves that market expansion, you need weekly operational metrics (leads generated, partnerships signed) feeding into monthly performance indicators (revenue run rate, customer acquisition cost) that roll up to quarterly strategic KPIs (market share, ROI). Without this cascade, boards are essentially flying blind for months before anyone flags a problem.
| Decision Type | Primary KPIs | Reporting Cadence | Tolerance Range | Escalation Trigger |
|---|---|---|---|---|
| Strategic Initiative | ROI, Market Share, Revenue Growth | Monthly to Board Committee, Quarterly to Full Board | ±15% of target | 2 consecutive periods outside range |
| Capital Allocation | IRR, Payback Period, Utilization Rate | Quarterly | ±10% of projection | Single period >20% variance |
| Risk Management | Risk Score, Incident Rate, Exposure Value | Real-time dashboard, Monthly summary | Defined by risk appetite | Any critical incident |
| Compliance | Audit Findings, Violation Count, Remediation Time | Quarterly | Zero tolerance on violations | Any material finding |
| Executive Performance | OKR Achievement, 360 Score, Succession Readiness | Semi-annual | 80-120% of target | <70% achievement |
The RACI matrix matters here too. For each KPI, you need a clear owner (accountable), data provider (responsible), board committee (consulted), and full board (informed). Without that clarity, metrics become orphaned — updated inconsistently, questioned constantly, and eventually ignored.
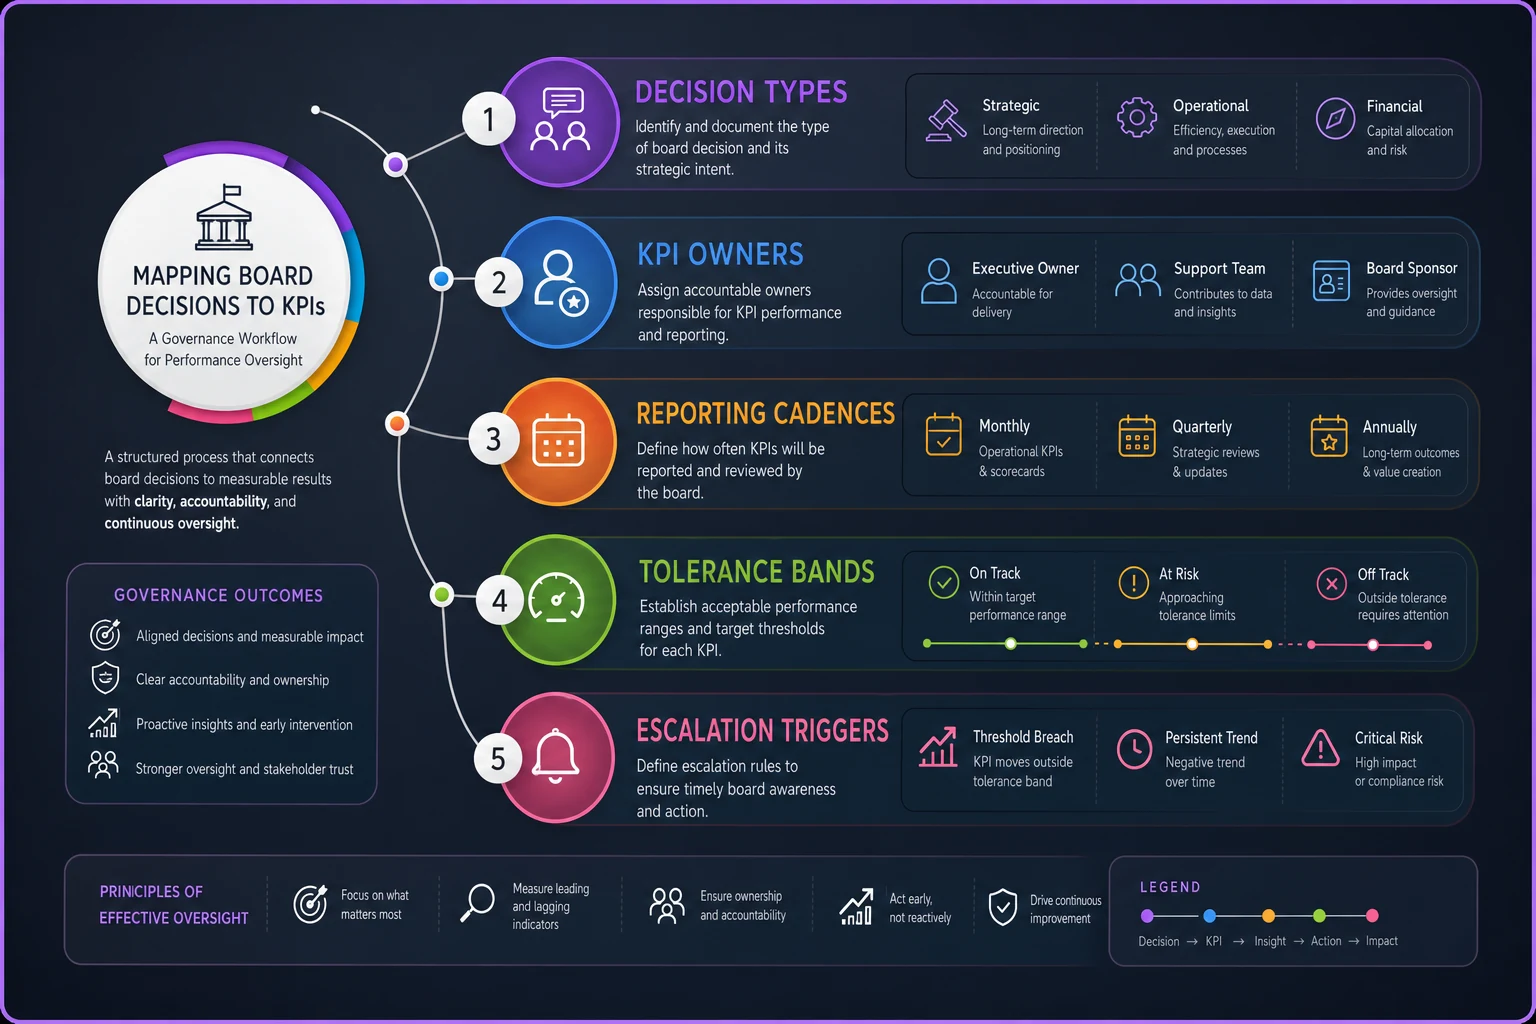
This workflow shows how decisions map to KPIs, owners, cadences, and escalation points.
Dashboard templates that actually drive decisions
Most board dashboards fail because they're designed for reporting, not decision-making. A functional framework needs dashboards that answer specific questions tied to board responsibilities, not just display charts that look polished in a slide deck.
Your strategic initiative dashboard should show decision quality, not just outcomes. Include metrics like "decisions reversed within 90 days" or "initiatives requiring material scope change." These meta-metrics give boards a way to assess whether they're making good decisions, not just tracking results after the fact.
For capital allocation, the dashboard needs to show both individual investment performance and portfolio-level metrics. Directors need to see concentration risk, performance distribution, and — probably most importantly — opportunity cost. What returns are you missing by keeping capital in underperforming areas?
Risk dashboards are a different animal. Static risk registers don't work for board oversight. You need dynamic risk scoring that shows how risks shift based on business decisions and external factors. Include velocity metrics alongside absolute risk levels — how fast is a risk growing or shrinking?
Compliance dashboards should focus on systemic patterns, not individual violations. Show root causes and remediation effectiveness. If the same compliance issue surfaces three quarters in a row, that's a governance failure, not an operational one.
Implementing tolerance bands and escalation triggers
KPIs without tolerance bands are just numbers on a page. Your framework needs clear boundaries that define when a metric requires board attention versus when it's within normal operating range.
Set tolerance bands based on decision criticality, not uniform percentages. A 10% variance in customer acquisition cost might be fine. A 10% variance in a regulatory compliance score could require immediate intervention. These bands should also tighten as initiatives mature — wider tolerance during pilot phases, narrower bands once something hits steady state.
Escalation triggers need to be automatic, not subjective. When metrics breach tolerance bands, notifications should go immediately to committee chairs and relevant directors rather than waiting for someone to notice at the next quarterly meeting. This is where AI automation genuinely earns its keep in board governance — real-time alerts when intervention is actually needed, not after the fact.
Build in velocity triggers alongside performance triggers. A metric might be within tolerance today but heading toward a breach. Boards should know about deteriorating trends before they become crisis points, not during them.
The data mapping architecture that makes it work
Behind every functional board reporting framework is a data architecture that most organizations underestimate. You can't pull numbers from different systems and hope they align. You need a structure that ensures consistency across all board reporting.
Start with source system identification. For each KPI, document where the data comes from, how it's calculated, and what assumptions are baked in. This sounds basic, but organizations regularly make significant decisions based on metrics that different executives are calculating differently.
Create a single source of truth for board metrics. Not one database necessarily — but one definition, one calculation method, and one owner for each KPI. When finance and operations both report customer lifetime value, they should be using the same formula pulling from the same data sources.
The mapping also needs version control. When a KPI definition or calculation method changes, the board needs to know. Include metadata in dashboards showing when metrics were last updated and what changed. This prevents the "wait, are we measuring the same thing we discussed last quarter?" conversations that eat up meeting time.
Decision quality drilldowns that prevent repeat mistakes
Most boards never systematically analyze the quality of their past decisions. They might discuss a failed initiative, but without structured decision quality metrics, they can't identify patterns in where their decision-making breaks down.
Build decision scorecards that evaluate process quality, not just outcomes. Did the board have complete information? Were alternatives properly considered? Was the risk assessment accurate? These process metrics help boards improve how they decide, not just track what happened.
Track decision velocity alongside decision quality. Some boards pride themselves on speed but never measure how many quick decisions later require reversal or major modification. Others deliberate endlessly without tracking the opportunity cost of the delay.
Run post-decision reviews that feed back into the framework. When an initiative fails — or succeeds beyond expectations — update your KPI mappings, tolerance bands, and escalation triggers based on what you learned. That's how a board reporting framework evolves from a static template into something that actually improves governance over time.
Making the framework operational
Implementation is where most frameworks fall apart. Templates and dashboards aren't enough — you need operational discipline to make the whole thing actually work.
Start with one strategic initiative as a proof of concept. Map its decisions to KPIs, set up the dashboard, establish ownership, and run it for a quarter. Use that pilot to find gaps in your data architecture and refine your tolerance bands. Organizations that try to implement everything at once usually end up with nothing working properly.
The corporate secretary role becomes important here. They need to ensure every board decision gets coded correctly, mapped to appropriate KPIs, and assigned clear ownership. This goes well beyond traditional minute-taking — it means operationalizing board decisions with proper follow-up mechanisms.
Training matters more than boards usually expect. Directors need to understand not just how to read dashboards but how to use them for actual decision-making. Running working sessions where directors practice the framework against real scenarios tends to surface framework gaps before they cause problems in live meetings.
Run a quarterly "KPI hygiene" check with owners to ensure definitions and calculations haven't drifted.
Start small and iterate. Use the pilot to build credibility and fix issues before wider rollout so the framework actually sticks.
Avoiding the common framework failures
The most common failure is over-engineering. Organizations build frameworks with 150–200 KPIs, assuming more metrics means better governance. In practice, boards can effectively track maybe 20–30 key metrics. Everything beyond that becomes noise that hides the signals that actually matter.
Static frameworks are another common problem. Your business changes, strategy shifts, and your reporting framework needs to keep up. Build in quarterly reviews to assess whether your KPIs still reflect what the board actually needs for its decisions.
Don't underestimate the human element. Even a well-designed framework fails if executives treat it as compliance overhead. When executives understand exactly which metrics matter for board decisions, they stop spending time generating custom reports for every meeting.
Metric gaming is also worth watching. When specific KPIs get tied to board oversight, some executives optimize for those metrics at the expense of broader performance. You need enough coverage to prevent gaming without so much that focus gets diluted across dozens of numbers.
The governance transformation that follows
Organizations that successfully implement this kind of framework see changes beyond just better board meetings. Directors stop micromanaging because they trust what they're seeing. Executives stop dreading board interactions because expectations are clear. Strategic decisions happen faster because everyone is working from the same data foundation.
The framework also builds institutional memory that survives leadership changes. New directors can get up to speed on how the board makes decisions and measures success. New executives inherit clear KPI ownership and reporting expectations. That continuity prevents the governance reset that often follows major leadership transitions.
More than anything, it shifts board focus from backward-looking reporting toward forward-looking strategy. When operational metrics are properly mapped and monitored, boards spend less time questioning numbers and more time discussing what to do about them.
Building your implementation roadmap
Start with an audit of where you are now. What decisions does your board regularly make? What metrics do you currently track? Where are the gaps between decisions and measurement? That baseline tells you how much framework development you actually need.
-
Phase one
map existing decisions to current KPIs and identify gaps.
-
Phase two
build missing data connections and establish ownership.
-
Phase three
implement dashboards and tolerance bands.
-
Phase four
add automation and escalation triggers.
Each phase realistically takes 60–90 days, which puts a working framework within reach inside a year.
Deliver value throughout the process, not just at the end. As soon as you have one decision type properly mapped with working KPIs and dashboards, start using it in meetings. Incremental progress builds support for continued development better than waiting for a complete rollout.
Technology should support the framework, not drive it. Modern governance platforms can automate data collection, dashboard generation, and escalation triggering. But technology without proper framework design just digitizes dysfunction. Get the structure right first, then use technology to scale it.
Perfect is the enemy of functional. Your first iteration won't capture everything. That's fine. A working framework that covers 80% of board decisions beats a theoretically comprehensive one that never gets off the ground.
The goal isn't polished documentation. It's a living governance system that helps your board make better decisions faster with clearer accountability. Every element should serve that purpose, and anything that doesn't should be cut.
The boards that navigate complexity well aren't the ones with the most data or the best-looking dashboards. They're the ones that connect decisions to metrics, assign clear accountability, and keep improving the process over time. That's what a proper board reporting framework actually delivers.
Ready to enhance your board's productivity?
Join 500+ organizations using Panlly to save time, improve governance, and streamline board operations.