


Most ESG oversight failures don't happen at the strategy level. The board agrees on the material topics, signs off on the sustainability report, nods along to the emissions targets. That part usually looks fine on paper.
Where it falls apart is one layer down — in the plumbing. Who actually owns the number? Where's the evidence that supports it? What happens when a metric drifts outside the range it's supposed to stay in? Who gets told, and when?
That's the gap this playbook is about. Not "should we care about ESG" — you've moved past that — but the operational scaffolding underneath the disclosures. The part auditors probe, investors question, and boards discover is missing only when someone asks a hard question they can't answer.
The oversight failure nobody catches until it's expensive
A pattern comes up again and again. A company publishes a Scope 1 and 2 emissions figure. It looks clean. Then an assurance provider asks a simple question: how was this calculated, and can you show me the source data behind three of these facility numbers?
Suddenly there's a scramble. The number came from a spreadsheet maintained by someone in facilities who left four months ago. The emission factors were pulled from a version of a standard that's since been updated. Two of the facility readings were estimated, not metered, and nobody flagged that in the disclosure.
None of that means fraud. It means the disclosure was published faster than the evidence trail could support. And that's the actual ESG oversight problem — not bad intentions, but a reporting cadence that runs ahead of the assurance foundation underneath it.
This is a board problem and not just a management problem for a straightforward reason: the board attests to oversight. When investors or regulators come asking whether directors had a defensible process for reviewing ESG claims, "we trusted management's summary" doesn't hold up. You need to show the mapping — topic to owner to tolerance to evidence.
Why this breaks across so many companies
ESG data lives everywhere except in one place. Emissions sit in facilities and procurement. Diversity numbers sit in HR. Governance metrics sit with the corporate secretary. Supply chain data sits with sourcing. Safety incidents sit with operations.
Eliminate boardroom chaos with seamless coordination.
Panlly simplifies scheduling, collaboration, and follow-ups for every board meeting.
- Centralized meeting scheduling
- Secure document sharing
- Task assignment & tracking
No credit card required
Financial reporting solved this problem decades ago with controls, reconciliations, and clear ownership. ESG reporting is roughly where financial reporting was before anyone took internal controls seriously — lots of numbers, unclear provenance, and a heavy reliance on whoever happens to know where the file lives.
A few patterns tend to compound the problem:
-
No single owner per metric. Three people touch the water-usage number, none of them own it. When it looks wrong, everyone assumes someone else checked.
-
No defined tolerance. The board sees a diversity figure move from 34% to 31% year over year and has no pre-agreed sense of whether that's noise or something worth a conversation.
-
Evidence assembled after the fact. The support for a claim gets pulled together the week before the report ships, which is exactly when nobody has time to verify it properly.
-
Reporting cadence disconnected from data cadence. The board reviews ESG annually, but the underlying data changes monthly. By the time directors see it, the context is already gone.
At small scale, you can paper over all of this with a competent sustainability lead who keeps it in their head. That works right up until it doesn't.
What changes as you scale
The single-owner-in-their-head model has a hard ceiling. The triggers are predictable enough.
When you move from voluntary reporting to assured or mandated disclosure, the informal system collapses. An assurance provider doesn't care that Priya knows where all the numbers come from. They need documented ownership, documented methodology, and an evidence pack they can test.
When you go from one jurisdiction to several, definitions stop matching. What counts as a "reportable incident" or a "renewable energy purchase" differs by framework, and the person tracking it in one region isn't using the same rules as the person in another.
When you add acquisitions, you inherit ESG data with unknown quality. The acquired company's emissions baseline might be built on assumptions yours would never accept, and now it's rolled into your consolidated number.
The through-line: informal ESG oversight scales with headcount and complexity right up to a threshold, then fails all at once — usually during the first serious external review. Companies that handle this well build the operating model before the threshold, not during the fire drill.
The operating model: topic → owner → tolerance → evidence
The fix isn't more reporting. It's mapping each material ESG topic through four things most companies never write down in one place.
1. Assurance owner. One named person accountable for the accuracy of each metric. Not a committee — a person. They may pull data from others, but they own the number that reaches the board.
2. Tolerance band. The pre-agreed range within which a metric is considered normal, and outside of which it triggers a conversation. This is what turns a dashboard from decoration into a control.
3. Evidence pack. The documented trail behind the number — source data, methodology, assumptions, and who verified it. Assembled continuously, not reconstructed at report time.
4. Escalation trigger. The rule that fires when a metric breaks tolerance, defining who gets notified, how fast, and what the board sees.
Here's what a board-ready assurance matrix looks like when you lay it out:
| ESG topic | Metric | Assurance owner | Tolerance band | Evidence pack | Escalation trigger |
|---|---|---|---|---|---|
| Climate – emissions | Scope 1 & 2 (tCO2e) | Head of Sustainability | ±5% vs. plan trajectory | Metered data, emission factors, calc workbook, third-party spot check | >10% variance or unmetered estimate >15% of total |
| Workforce | Gender diversity, leadership | CHRO | Within 3 pts of prior year | HRIS export, definition memo, reconciliation | Drop >3 pts or definition change |
| Supply chain | High-risk supplier audits completed | Head of Procurement | ≥90% of tier-1 audited | Audit log, supplier register, exception list | <85% completion or unresolved finding |
| Governance | Board ESG training hours | Corporate Secretary | 100% directors current | Attendance ledger, credential records | Any director lapsed >90 days |
| Health & safety | Recordable incident rate | Head of Operations | ≤ industry benchmark | Incident logs, investigation files | Any fatality or 20% rise QoQ |
The value isn't in the table itself. It's in what filling it out forces you to discover — usually that two or three metrics have no clear owner, and one or two have no evidence trail at all. That discovery is the point.
The same discipline that makes financial disclosures defensible applies here. It's worth reading alongside a compliance-first approach to board records, because ESG evidence packs live or die by the same recordkeeping standards.
A simple visual of the assurance workflow can help teams see handoffs and escalation points.
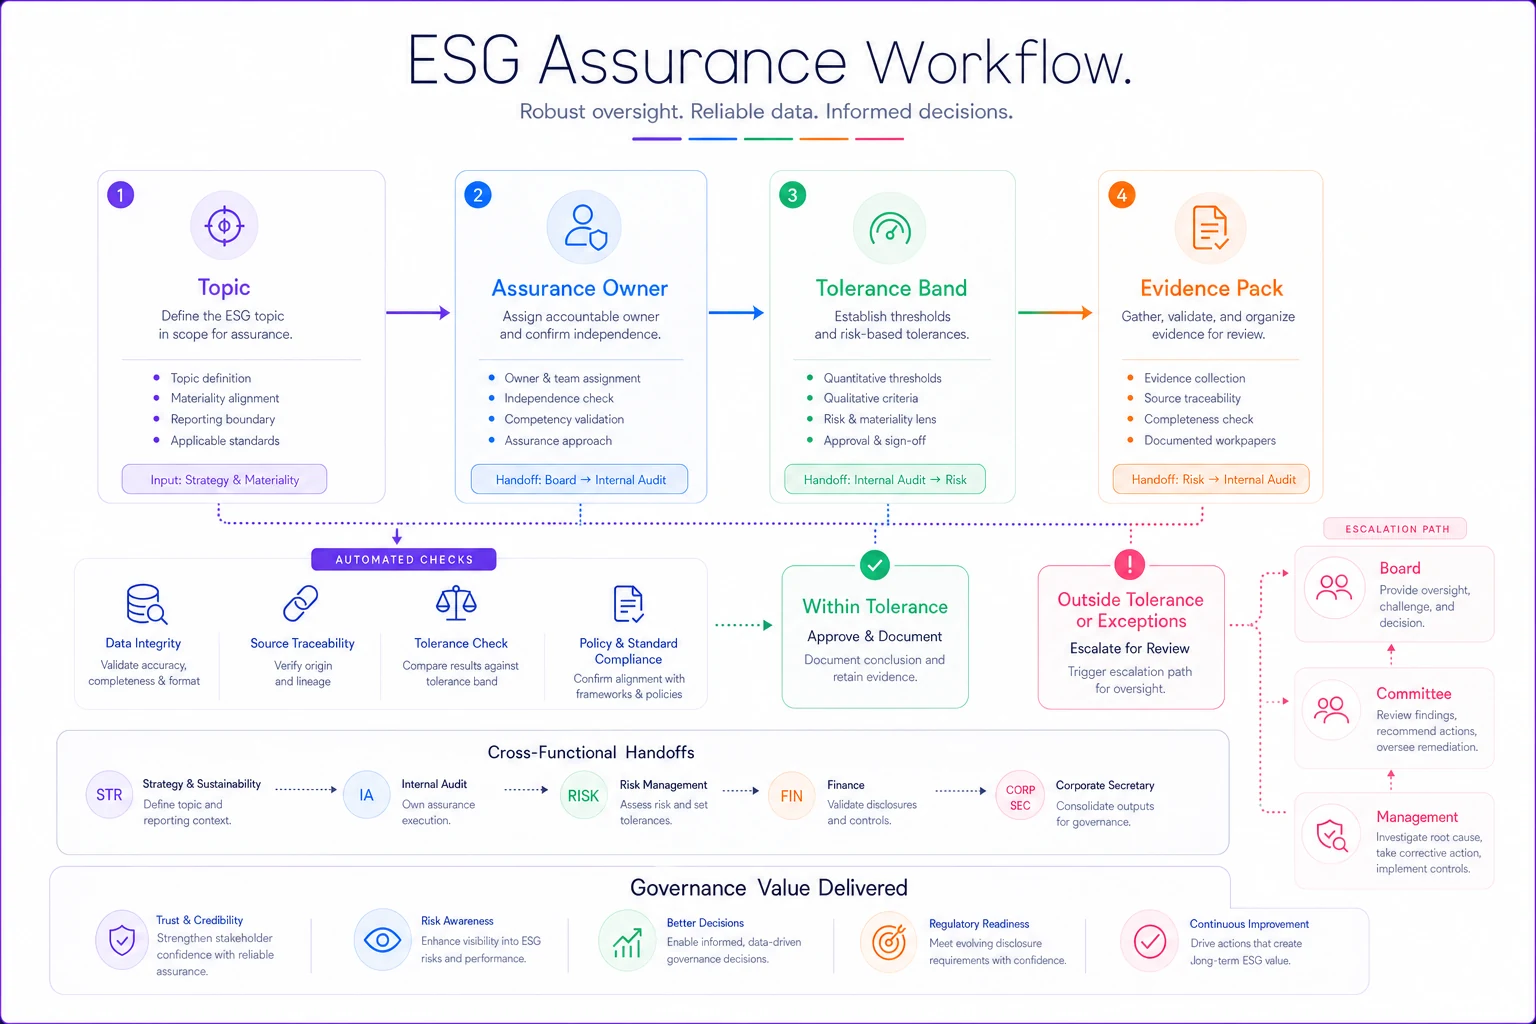
The matrix is a tool to surface gaps before an external review, not an end in itself.
Tolerance bands: the piece almost everyone skips
Most boards review ESG metrics without any sense of what "normal movement" looks like. A number goes up, someone says that's good, everyone moves on. A number goes down, there's mild concern, then the agenda moves on anyway.
Tolerance bands fix this by deciding in advance what movement actually means something. If your recordable incident rate is expected to sit at or below the industry benchmark and it's been climbing for two quarters, that's not a data point to note — it's a trigger.
Set a simple initial band using two to three years of history rather than waiting for a perfect statistical model.
A practical way to set bands: don't overthink the first version. Look at two or three years of history for each metric, mark the range that felt like normal fluctuation, and set your band a little inside the edge of your risk appetite. You'll refine it. The mistake is waiting for a perfect statistical model before setting any band at all, which means you set none, which means every number gets the same undifferentiated glance.
Worth flagging: tolerance bands also protect management. When a metric moves inside the band, there's no need to spend board time on it. That frees the agenda for the things that actually broke the band — which is where director attention belongs.
Escalation trigger logic
A tolerance band without an escalation rule is just a comment. The trigger logic is what connects a breach to an action. Keep it simple enough that it actually runs:
-
Metric breaks tolerance. The assurance owner is the first to know — ideally automatically, not because they happened to look.
-
Owner classifies within a set window. Is this a data quality issue, a real performance change, or a definition/methodology shift? Each goes a different direction.
-
Data issues get resolved and re-reported at the owner level, with a note in the evidence pack.
-
Real performance changes escalate to the relevant committee — usually Audit, Risk, or a dedicated ESG/Sustainability committee — with context and a proposed response.
-
Material breaches — anything touching disclosure accuracy, regulatory thresholds, or safety — go to the full board with counsel looped in.
-
Every escalation gets logged, including the ones that resolved quietly, so there's a defensible record that the process actually ran.
Step six is the part boards tend to forget. The breaches that resolved are as important to document as the ones that blew up, because they're the evidence that oversight was working continuously — not just when something went public.
The disclosure-prep checklist auditors and investors actually expect
When an assurance provider or a serious institutional investor digs in, they're testing whether your claims are supported. Run through this before the report ships, not after someone questions it:
-
Every material metric has a single named assurance owner
-
Methodology for each metric is documented and matches the framework you're reporting against
-
Source data is traceable to its origin (meter, system export, invoice — not a summary spreadsheet)
-
Any estimated or modeled figures are flagged, with the estimation method documented
-
Year-over-year definition changes are noted and reconciled
-
Restatements from prior periods are identified with a stated reason
-
Tolerance breaches during the period are logged with resolutions
-
The board's review of the disclosure is minuted, showing what was actually discussed
-
Evidence packs are complete and could be handed over without a scramble
-
Someone who didn't produce the numbers has reviewed them
That last item catches more errors than any of the others. The person who built the number is the worst person to check it — they'll just reproduce their own assumptions.
A real scenario
A mid-sized manufacturer — roughly 1,400 employees, three production sites, first year moving into limited assurance on emissions and safety disclosures.
Going in, ESG data lived across about eleven separate spreadsheets spread across four departments. No metric had a documented owner. The emissions number relied on a facilities manager at the largest site who'd been doing it "the same way for years" with nothing written down. When the assurance provider ran its first walkthrough, they flagged that around a third of the reported figures couldn't be traced to primary source data within a reasonable window.
The remediation wasn't glamorous. They built the assurance matrix — every material metric mapped to an owner, a tolerance band, and an evidence pack location. It took about six weeks of genuinely tedious work: mostly meetings to argue about who owned what, and phone calls to reconstruct methodology that existed only in someone's memory.
The following cycle, the assurance review that had taken close to three months of back-and-forth ran in roughly five weeks. The provider's findings dropped from a long list of data-provenance issues to a handful of minor methodology notes. More importantly, when a facility's incident rate breached its tolerance band mid-year, it surfaced to the Risk committee within weeks instead of showing up as a surprise in the annual report — which is exactly the kind of thing that turns into an investor question you don't want to field live.
The cost of the fix was mostly staff time. The cost of not fixing it would have been a qualified assurance opinion, and that's the sort of thing that follows a company around.
When this level of structure makes sense — and when it doesn't
When it's worth building the full model:
-
You're moving into assured or mandated disclosure
-
You operate across multiple jurisdictions with different reporting frameworks
-
Investors are actively questioning your ESG claims
-
You've made acquisitions and inherited data of unknown quality
When lighter is fine:
-
You're a genuinely small company with voluntary, high-level reporting and one person who reliably owns the data
-
Your material topics are few and the underlying data is simple and directly measured
Companies that build an elaborate assurance matrix for metrics nobody externally cares about are wasting board attention. The discipline should scale with the consequence of getting the number wrong. Spend the structure where a bad number causes a restatement, a regulatory issue, or a credibility hit — not on every metric you happen to track.
Connecting ESG oversight to the rest of the board's reporting
ESG metrics shouldn't sit in their own isolated report that the board sees once a year. The strongest oversight comes from folding these metrics into the same reporting rhythm the board already runs for financial and operational KPIs — same cadence, same escalation discipline, same evidence standards.
That integration is the real endgame, and it maps naturally to the broader work of connecting board decisions to KPIs through a proper reporting framework. When ESG metrics flow through the same pipes as everything else the board watches, they stop being a bolt-on compliance exercise and start behaving like actual oversight.
ESG oversight fails quietly. Nobody notices the missing evidence trail or the undefined owner until an assurance provider, a regulator, or an activist investor asks a question the organization can't answer cleanly. By then it's a fire drill, and fire drills produce weak disclosures.
The operating model — topic mapped to owner, tolerance, evidence, and escalation — isn't complicated. It's just work that companies keep deferring because the informal version seems to be holding. It holds right up until the day it isn't. Build the matrix before the review, not during it, and the whole thing shifts from a scramble into something you can actually stand behind.
Ready to enhance your board's productivity?
Join 500+ organizations using Panlly to save time, improve governance, and streamline board operations.